Your numbers
Intelligence in the sidebar is the long view: what happened after candidates met your assistant, and which of the things you published had anything to do with it. Home tells you what needs attention today; this tells you what is working.
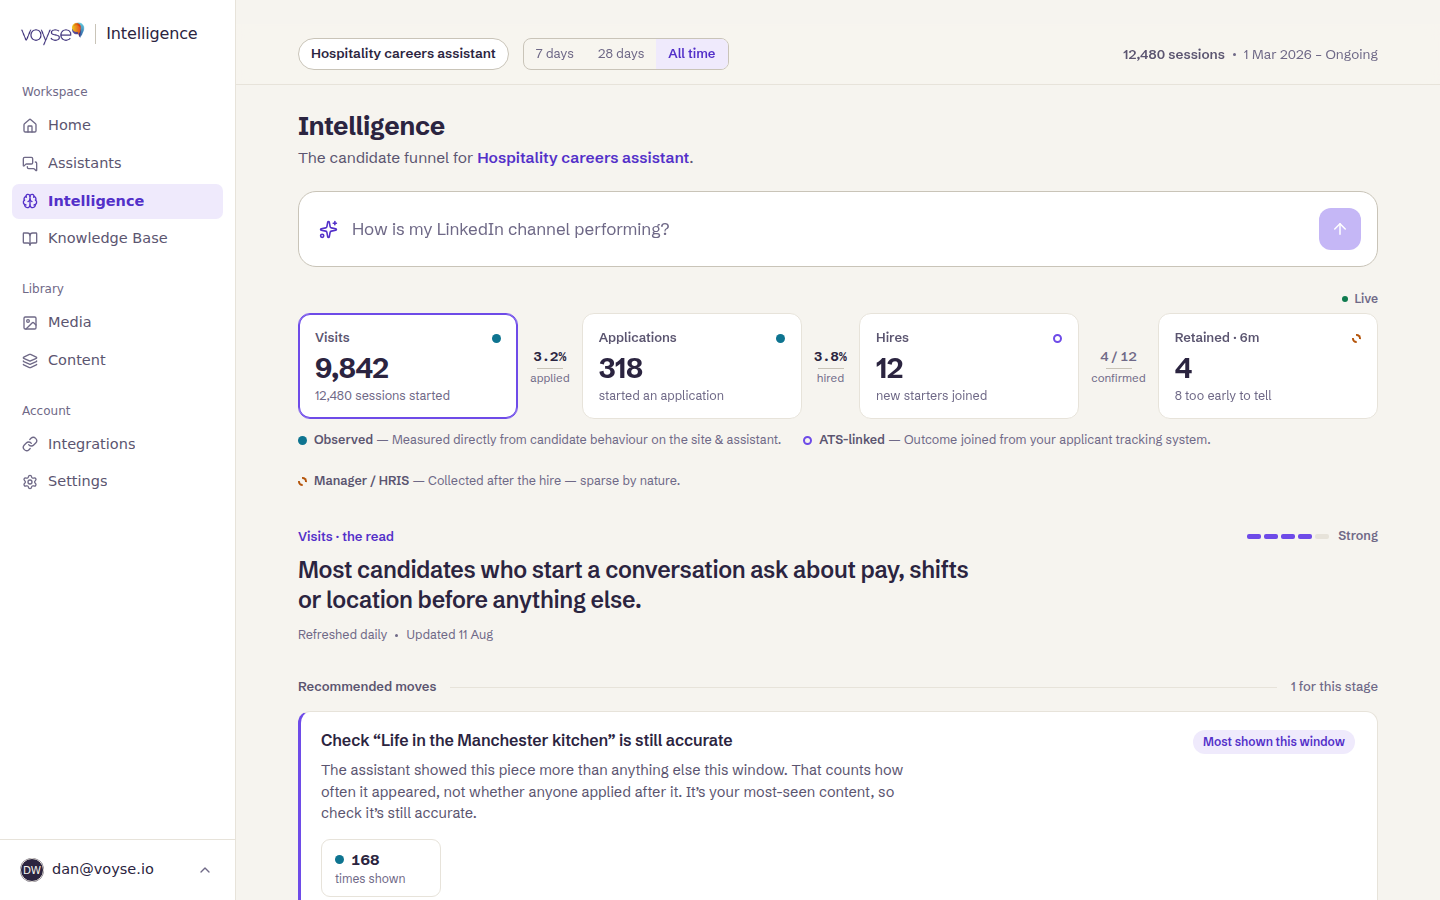
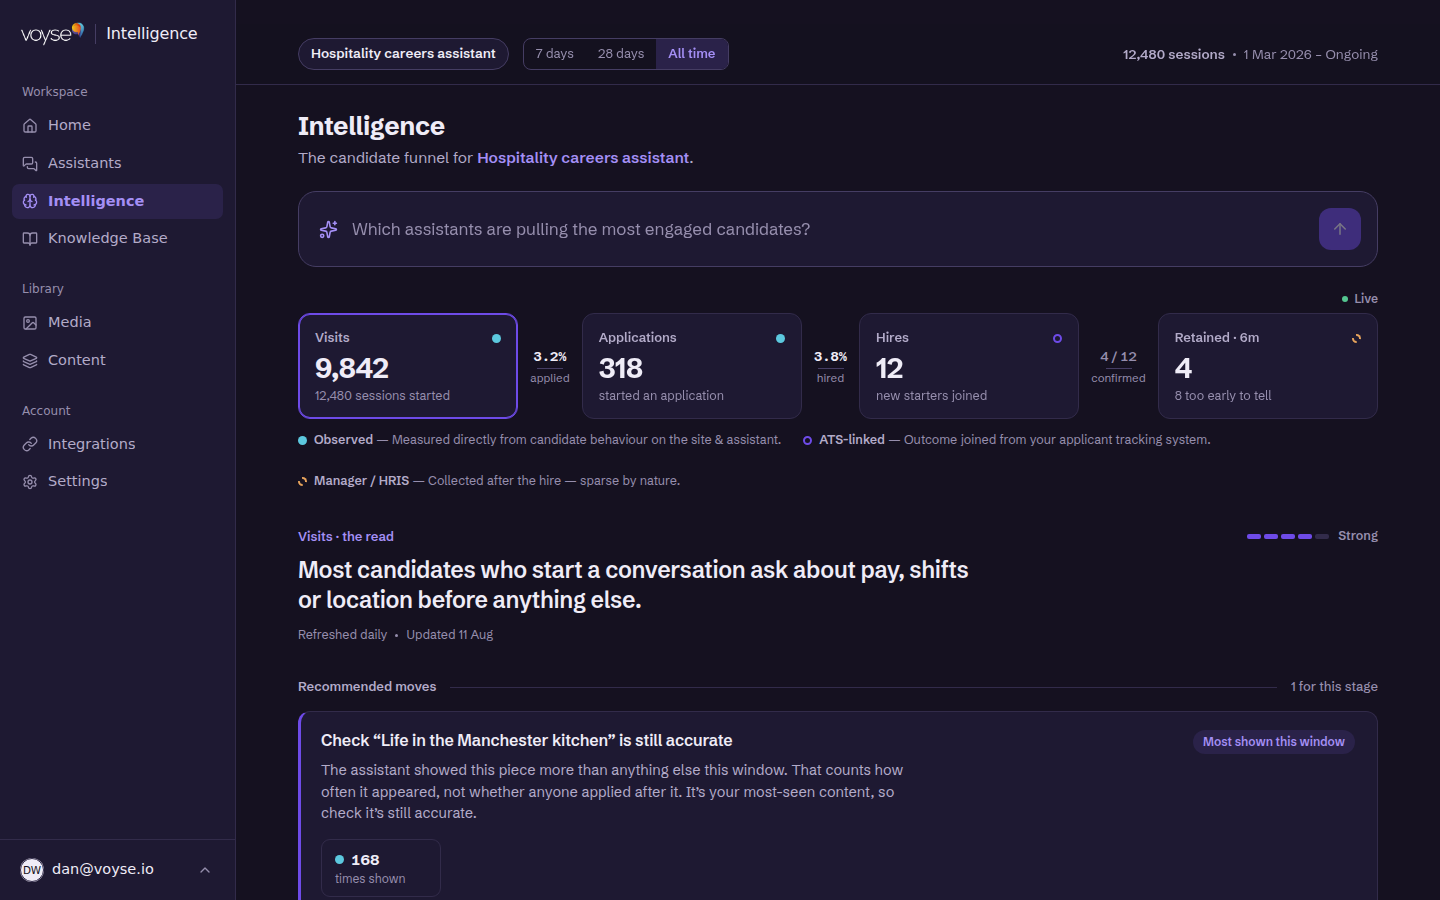
Choose which assistant you're looking at, and the period — 7 days, 28 days or All time. The counts are recalculated every time you load the page; the written read under them is refreshed once a day, and says when it last was.
Asking it a question
The field at the top takes a question in plain English — "why did applications drop in the last 7 days?", "which sources convert best into hires?" — and answers from your own numbers. Use it when you want something the panels below don't already show, rather than reading the whole page looking for it.
The funnel
Four stages across the top, each with the count for the period:
| Stage | What it counts |
|---|---|
| Visits | Candidates who arrived. |
| Applications | Applications submitted. |
| Hires | People hired. |
| Retained · 6m | Those still there six months on. |
Between each pair you'll see the rate that got from one to the next — the proportion of visitors who applied, of applicants who were hired. Each stage also carries a plain line about what its number is counting, and Retained · 6m says how many hires are too early to tell, rather than counting them as either kept or lost.
Selecting a stage changes the evidence below it, so you read the funnel by picking the stage you care about rather than scrolling. Each stage has the read — one sentence stating what the numbers for that stage show, with a mark of how strong the evidence behind it is.
Later stages may be marked as needing a different plan — a stage you can't select says which plan it comes with.
Where each number comes from
This matters more than the numbers themselves, because the three sources are not equally solid, and the view never pretends otherwise:
- Observed — measured directly from candidate behaviour on the site and the assistant. The firmest thing here.
- ATS-linked — the outcome as your applicant tracking system recorded it. As accurate as your ATS is kept.
- Manager / HRIS — collected after the hire, and sparse by nature. Someone has to have answered.
Every figure carries the mark of its source, with a legend where they appear. A retention number built from three manager replies is not the same kind of fact as a view count, and it isn't presented as one.
The evidence
Under the funnel, The evidence breaks the selected stage down:
- Roles drawing candidates — which roles brought people in.
- Content, ranked by apply rate — which of your content blocks and videos were shown to candidates who went on to apply.
- What candidates ask most — the subjects that come up, split by whether they were Answered well or are Still unanswered.
- Who we hired — and what they did first — for each hire, the path they took: what they viewed, what they were shown, when they applied, when they were hired, and whether they stayed.
- Manager check-in coverage — how many hires a manager has been asked about, and how they rated them.
Recommended moves
Recommended moves suggests what to do next, drawn from what the numbers show. Read them as observations with an action attached, not predictions: they describe what was measured, and none of them claims to know why a candidate behaved as they did.
When there isn't enough to go on
Voyse says so rather than filling the space:
- Low sample — there is data, but too little to act on. A pattern across twelve hires is a hint; across three it is noise.
- Not enough question signal yet — too few candidate questions in this period to say what they ask about.
- No role-level activity in this window yet — nothing happened on any role in the period you've chosen. Widen the window.
Correlation is not cause here. Content ranked by apply rate tells you what the people who applied had seen, which is worth knowing and is not proof the content did the persuading.